
Shape-Aware NECBL Pitching Sequencing Optimizer
During the 2026 season, there was a shift in the coaching staff with the Navigators, one that was more willing to listen to analytics, and from there, I wanted to make sure we were making the most sound pitching sequencing decisions possible, which meant developing an engine to evaluate our available arms against a specific lineup rather than in the aggregate (or scoring the arsenal on its own). Rather than profiling a pitcher by overall tendencies, the model looks at him as a cloud of the pitches he has thrown. Each pitch is a five-dimensional point in space (the five dimensions being: release speed, induced vertical break, horizontal break, plate location height, and plate location space), which are then z-scored so that MPH, break, and location contribute comparably to distance. As pitch quality is already encoded in the pitches themselves, no separate Pitching+ multiplier is applied at the time of matchup, which would then double-count it. For matchup evaluation, each pitch in the cloud is used as a query against every similar pitch (shape and location) that hitter and comparable hitters (plate discipline and contact quality) have seen, filtered to the same count bucket and pitcher-batter handedness, and then weighted by two Gaussian kernels, one on distance in the five-dimensional pitch space, with an adaptive bandwidth so that the window tightens when comparable pitches are densely packed and widens out when they are scarce, and one kernel on the hitter where each is a point in chase, whiff, and xwOBACON space. Pitches the hitter personally faced are weighted four times as heavily. Because every estimate is built from pooling the pitches most like the ones being thrown, an arm with only a handful of a specific pitch on the season is still evaluated against a myriad of near-identical shapes, which matters when a bullpen can turn over week-by-week in the NECBL. The resulting swing, whiff, foul, and batted-ball distributions are then walked through a 12-state Markov chain to a full plate appearance line, with contact through my xwOBACON model, and that line is dotted with the run values from my Pitching+ model to give xRV for that pitcher against that hitter.
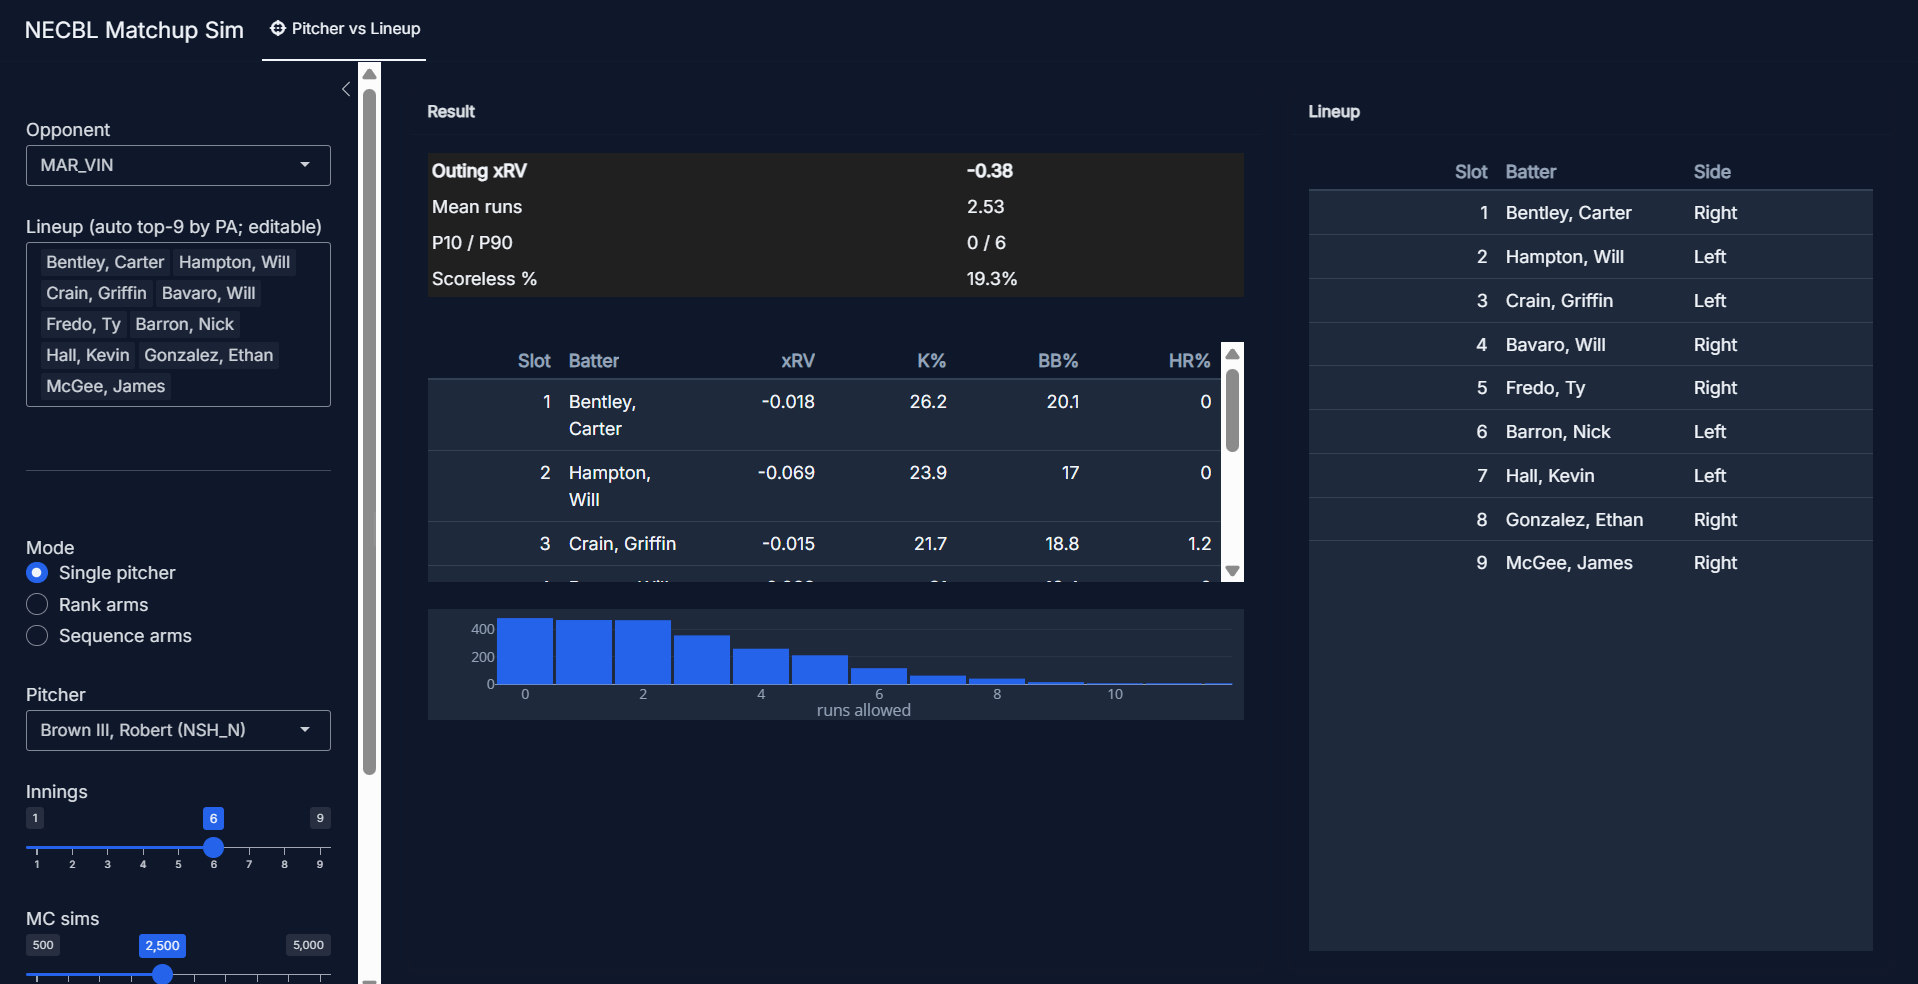
This is the view after entering in a lineup versus a singular arm. It returns the expected run value for each individual matchup along with the total for the lineup as a whole, which can be edited manually (initially set by top 9 PA totals), and the innings and simulation sliders set how long both the outing runs and how many times this simulation gets played out. Once we get here, every batter in the projected starting lineup, one through nine, gets a plate appearance line built from scratch, with the arm's cloud sampled per count bucket, with each pitch queried against the hitter's response, and then walked through the count chain. The output is a full line for everybody in the lineup one through nine, with the xRV along with K%, BB%, and HR%, rather than a singular number for the lineup as a whole, as it is useful to see where in the order an arm profiles well and where he does not. As seen in this figure, Robert Brown III, one of the Navigators' top arms, projects to a −0.38 outing xRV over six innings against Martha's Vineyard, with a mean of 2.53 runs allowed, a 10th-to-90th percentile range of 0 to 6, and a 19.3% chance of a scoreless outing. The xRV column is the run value created for each offensive player in their plate appearances, so league average sits at 0, and a negative numbers means that the arm has the upper hand. The K% and BB% columns represent the absorption probabilities of the count chain, or the share of simulated PA's that end in a walk or strikeout, which is why Gonzalez's projected K rate is 30.1%, which is different than his overall K%, but is what the total is when facing Brown. HR% works the same way, coming out of the batted-ball distribution scored through the xwOBACON model rather than from actual home runs. The outing total for Brown of -0.38 xRV is a sum across the PAs that the 6-inning outing implies at roughly 4.3 per inning, so it scales with the innings rather than being a rate, so to speak. At 6 innings that top of the order is coming up for a third time. The percentiles, the scoreless rate, and the mean runs allowed come from running the nine lines through the base-out states 2,500 times, which I found to be much better than running just an xRV total-based model, as that would be context-neutral/additive, while the mean runs knows that the order of which plate appearance outcomes occur matter to run scoring.
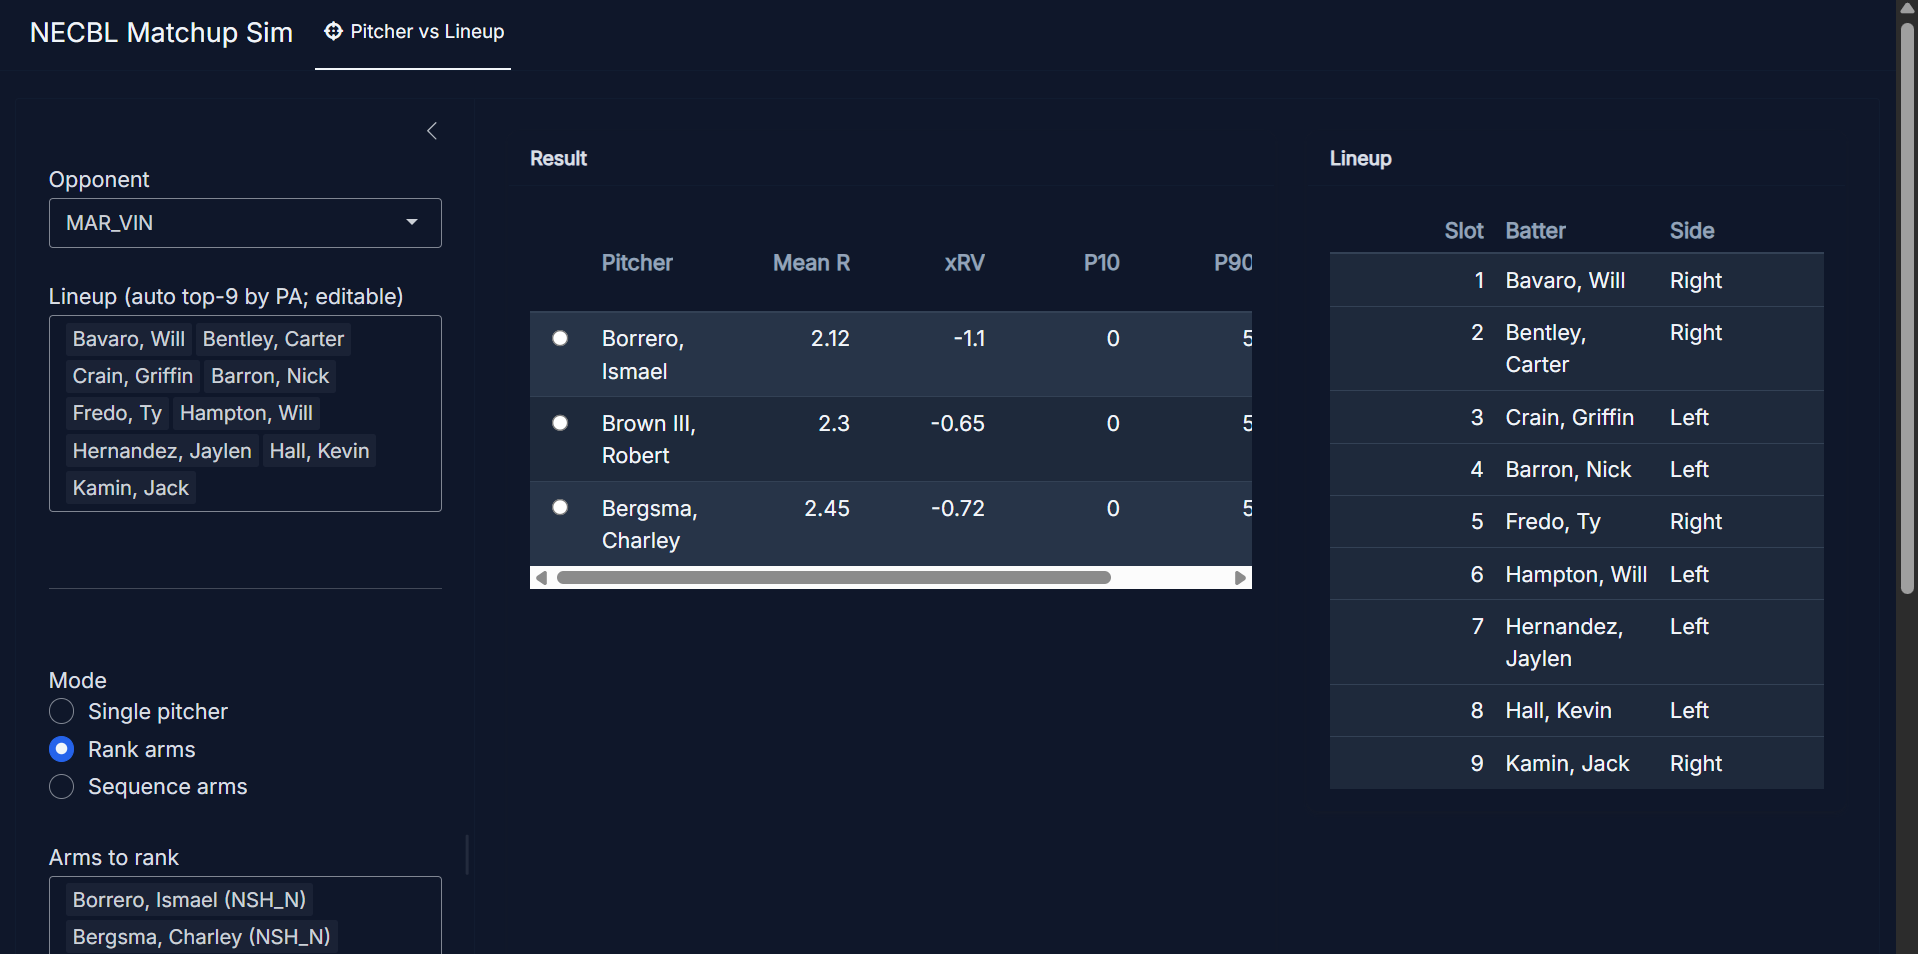
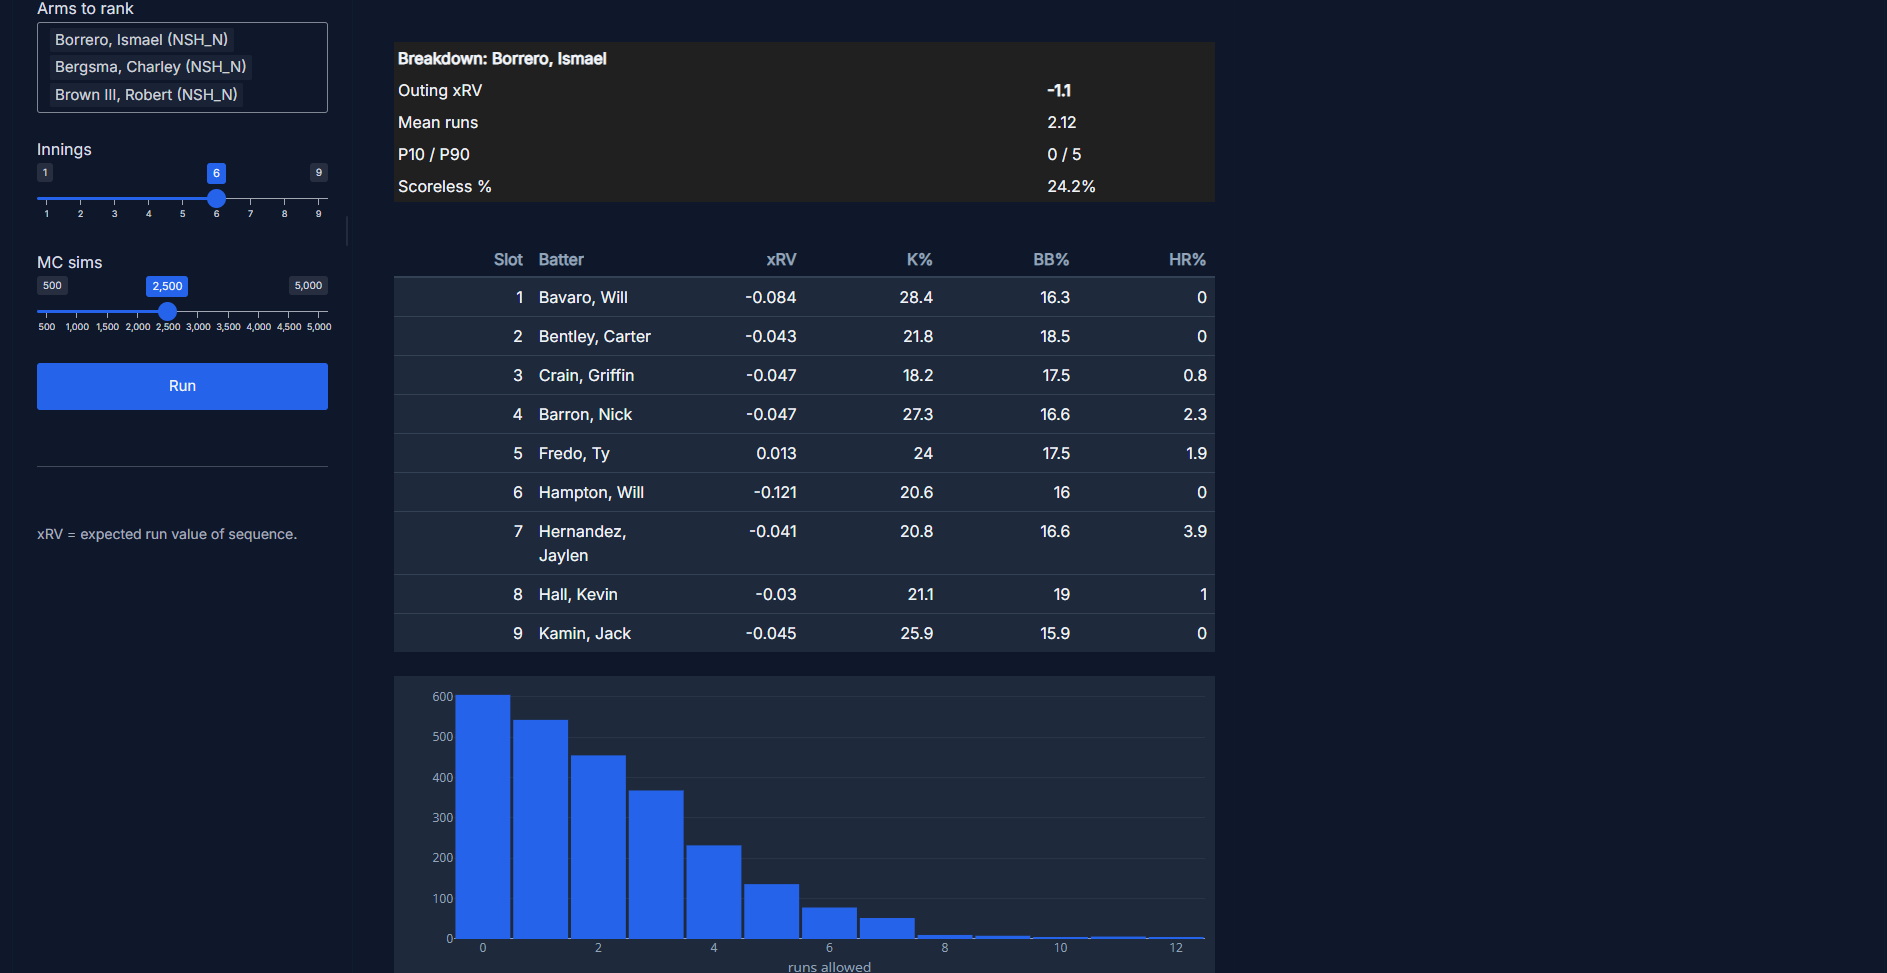
Another option is to rank arms versus a specific lineup. The rank arms function takes whichever pitchers you select, and runs the same full matchup for each one against the selected lineup, initially sorts them mean runs allowed rather than xRV, with any row expandable beyond it (see second image, where I clicked to expand beyond Borrero's outing). Sorting on mean runs, in my opinion, is the right default for this option, as it is the only column that is sequencing-aware. xRV is additive/neutral, so it added each plate appearance on its own, while mean runs plays those nine batter lines through the base-out states, where the order in which baserunners and outs occur matters and decides the score. As seen in the first image, with Ismael Borrero, Charley Bergsma, and Robert Brown III (three Navigators pitchers), I simulated 2,500 6 inning outings. After the simulations run, you can see that Borrero comes back at 2.12 mean runs allowed, with Brown at 2.30 and Bergsma at 2.45; however, the other currency, xRV, disagrees behind them, with Bergsma at-0.72 and Brown at-0.65, which would flip the second and third arms if the table chose to sort by that option. In these tables are also 10th and 90th percentile outcomes, which I felt helped to visualize for a non-technical audience how the tool worked, so that they could see best- and worst-case scenarios (so that they didn't necessarily think that precisely x number of runs would score). All three arms (Borrero, Bergsma, Brown) have identical tails, with a 10th percentile outcome of 0 and a 90th of 5, which shows that the main separation between these three arms comes in the middle of the distribution rather than the top or bottom end outcomes. When you select an arm, as mentioned previously, it unpacks the top-line numbers to show the breakdown and distribution of runs. This image, in which I chose to look at Borrero's outing, shows that 8 out of the 9 batters in the lineup represent favorable matchups for the right-hander, with only Ty Fredo (+0.013) profiling above water against him. It also shows the projected K rates against for each batter. Then, below, I added a histogram option to see the true distribution of sims beyond the 2.12 mean, skewed the way run scoring actually is.
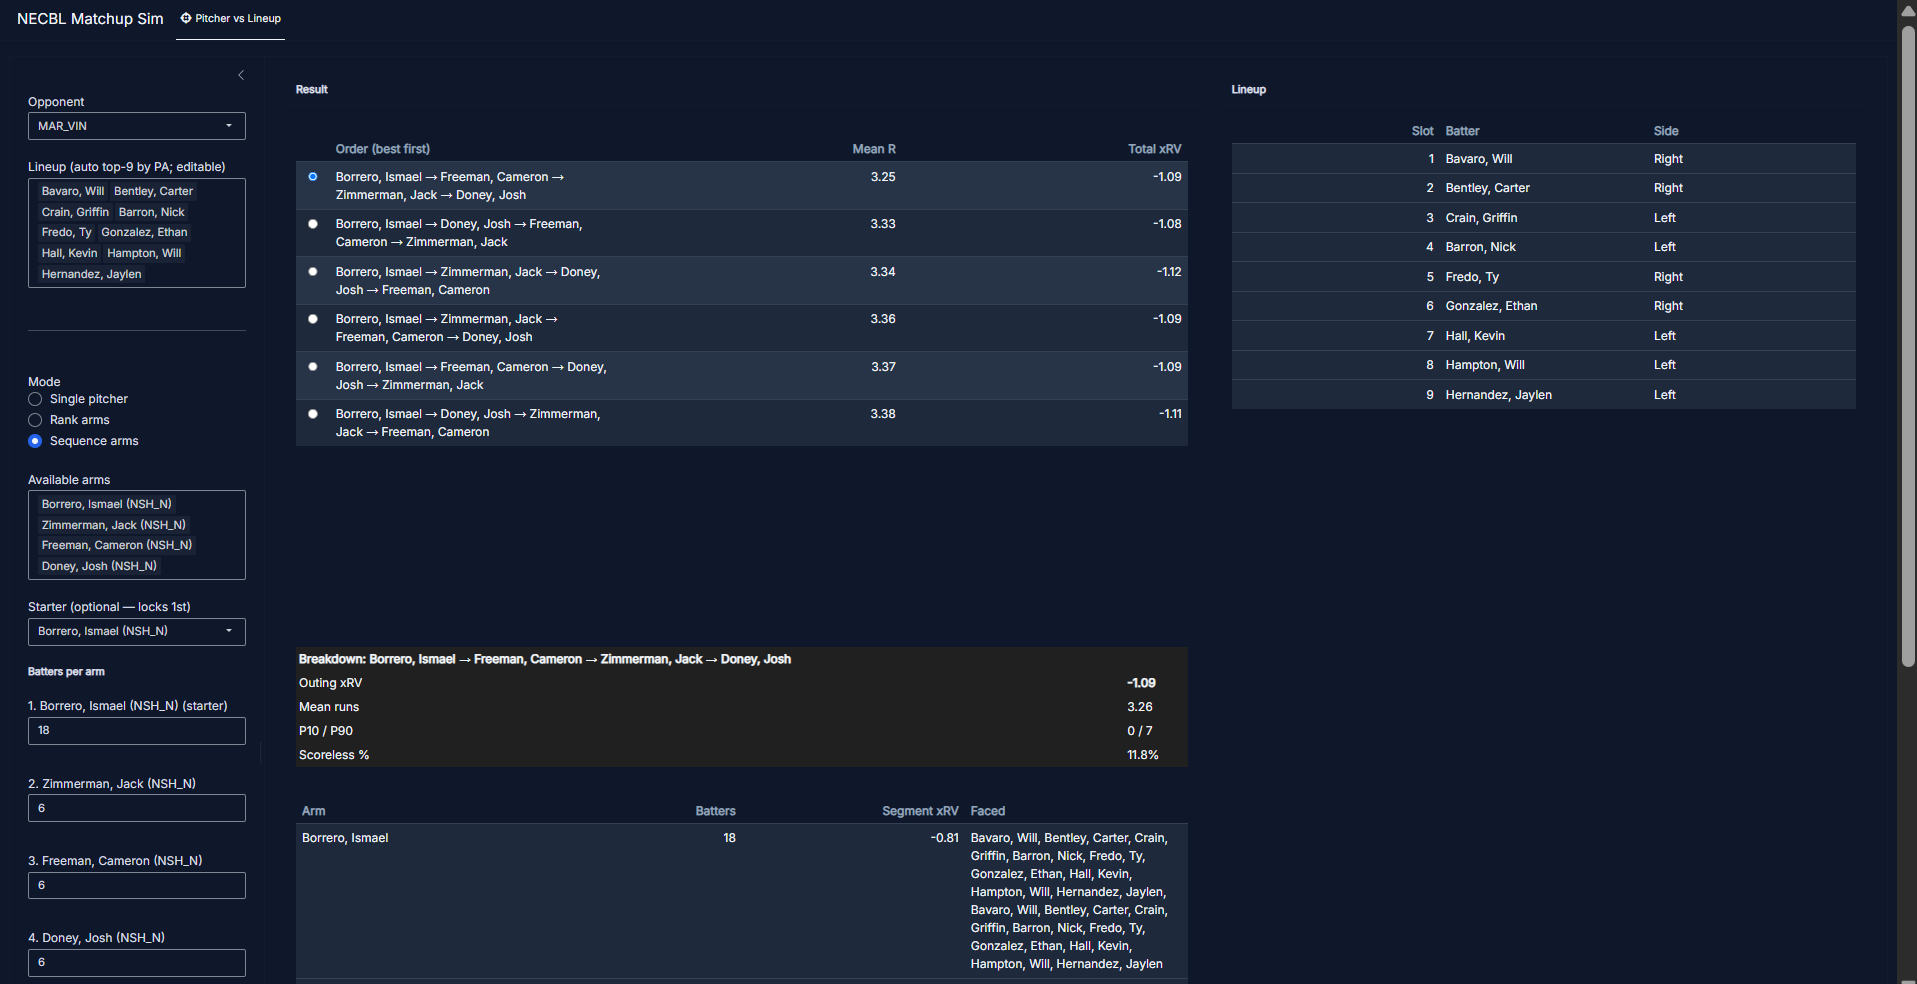
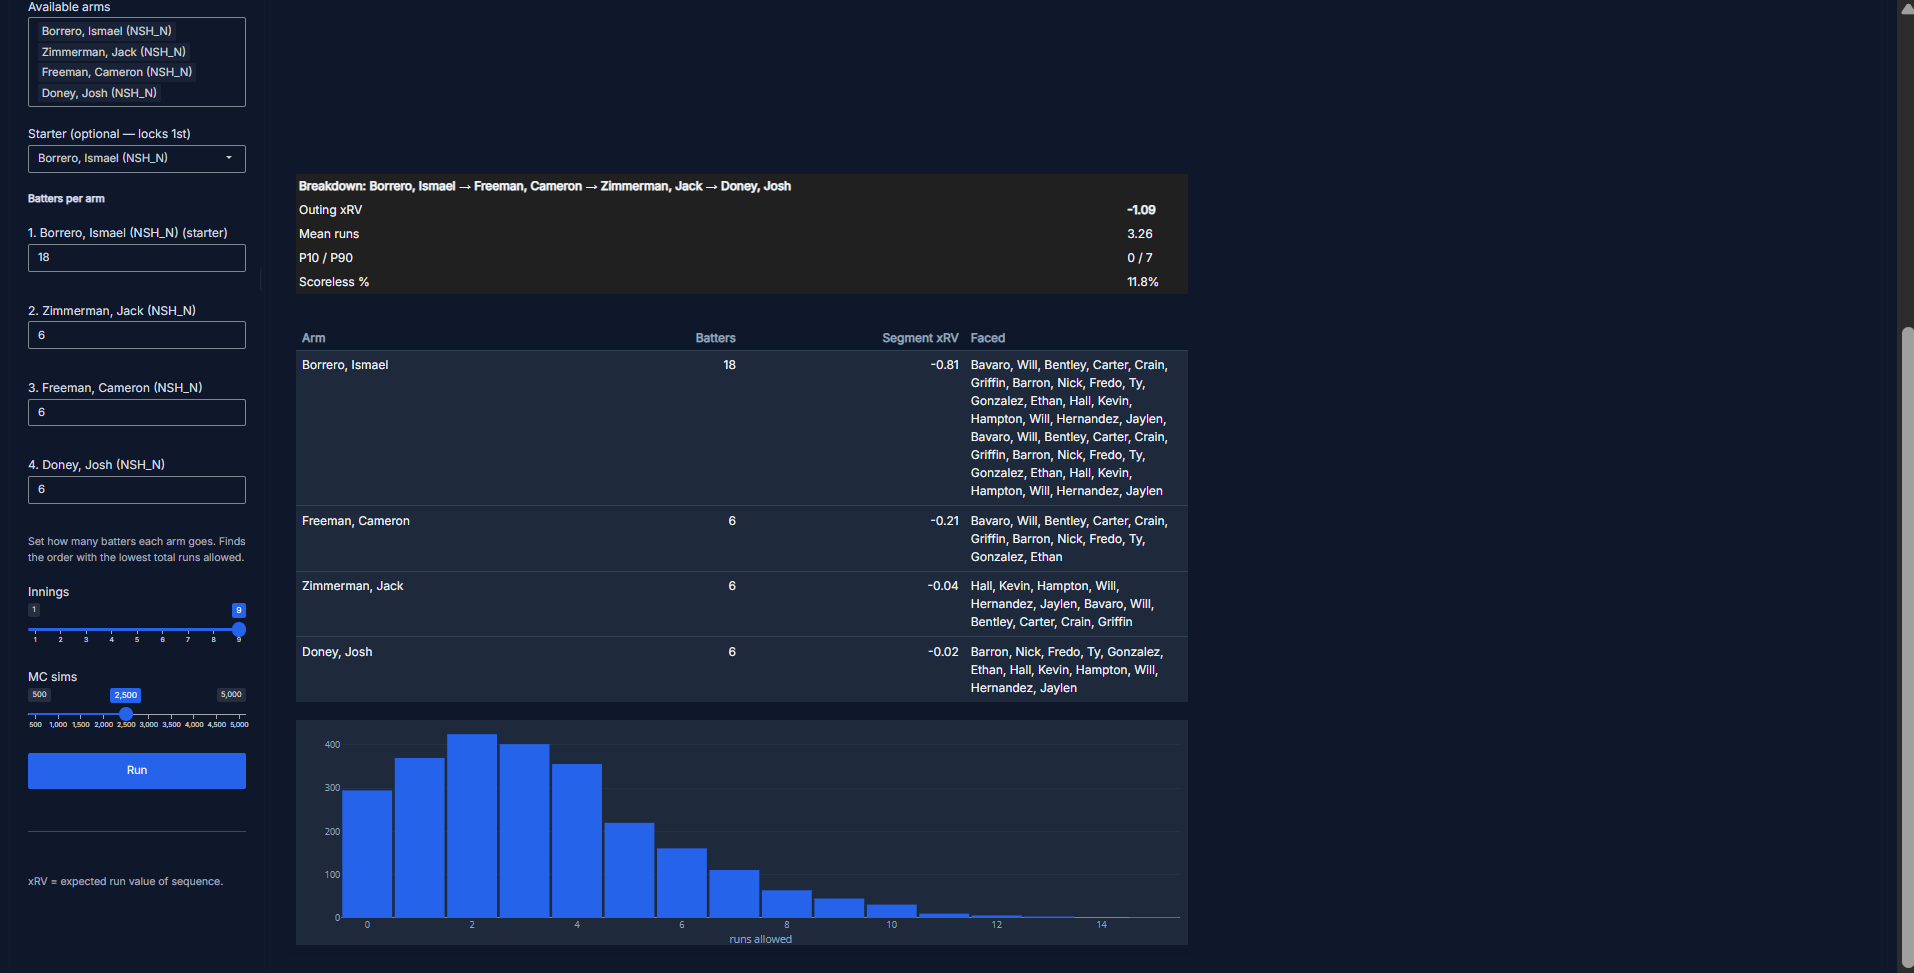
Now we get to the sequencing tool, which is the mode that gets the most usage, and it what I built this towards. The user picks the arms who are available that day, and set how many batters each can go. As in the rank arms section, I found Ismael Borrero to be the optimal starter, I chose him to slot in first with 18 batters, and 6 each for the potential relievers (Jack Zimmerman, Cam Freeman, and Josh Doney). This covers 36 batters or 4 times through the order. Locking in a starter cuts down the search to the orders of the three relievers behind him, and each sequence is then ranked on mean runs allowed per simulation rather than total summed run value, so the sort accounts for the order in which baserunners and outs arrive. Locking in a starter is entirely optional; the user can just leave it empty, and it will give true optimum, oftentimes with an opener as the true optimal sequence of arms. As seen in the second image, all orders came back within a thirteen-hundredths-of-a-run band, with Borrero to Freeman to Zimmerman to Doney at 3.25 mean runs per nine innings, to Borrero to Doney to Zimmerman to Freeman at 3.38. The tightness of the margins is worth noting, as bullpen sequencing, statistically speaking, is a marginal edge and not a major change, and what the tool is good for is knowing which marginal end an order of arms sits on. There is, again, an option to drill down further when the user selects an order. It is then broken down into segments, and the breakdown then shows how the run value accrues over the course of the game. The "Faced" column was an important add, and what makes the ordering of things legible, as Freeman, in this case, draws Bavaro through Gonzalez (the top of the order a third time through), while Zimmerman picks up Hall, Hampton, and Hernandez before wrapping back around to the top of the order, and then Doney finishes on Barron through Hernandez. That mechanism is why the order matters here, as the arms are fixed and the lengths are fixed, so the only thing changing is which six hitters each reliever inherits. It also helps to show which individual pitcher lines up better against specific batters in the lineup. The 3.26 in the breakdown against the 3.25 in the table is just noise between two runs of the simulation, which is what the sim-count slider trades against, and the histogram seen below is wider than any single-pitcher outing, peaking at 2-3 runs, with a tail beyond 14, as it is covering 9 innings rather than 6.