
Shape-Aware NECBL Lineup Optimizer
Coming out of the same 2026 shift with the Navigators coaching staff, I wanted to make sure we were putting out the best possible lineup each and every night that were reflective of the specific arm we were facing that night rather than simply a general read on how good a pitcher is, or by going off of platoon splits. This meant running the same engine as the pitching sequencing optimizer in the other direction (hitters versus a specific starter). Rather than profiling a starter by his tendencies (he throws 50% SL, 35% FB, 15% CH; thus let's bat this guy who generally hits sliders well high), the model uses the pitches he has actually thrown: velocity, movement, where each crossed the plate, and in the counts he threw them and to each handedness. For every one of those, it looks at how the hitter has done against pitches like it, matched to the same space, count, and handedness through a kNN search — a sinker in an 0-2 count from a right-hander, 12 inches of vertical break and 18 armside, down and in, and what this hitter actually does with that. What comes back is swing, chase, whiff, and foul, along with what he does on contact, with contact running through my xwOBACON model. On a thin sample, it fills in from similar hitters against that same pitch, weighted by how close the pitch (through kNN search in shape and location) is and how similar the hitter is (kNN of xwOBACON and plate discipline), with the pitches he personally faced weighted four times as heavily, so that, for example, if a batter has only seen three sliders from a lefty down and in, it doesn't get washed out by the average. Those rates are walked through the count chain to a full plate appearance for every batter in the lineup, and from there, the order itself isn't ranked by summing all possible xRV variations, instead, each possible order combination is played through the 24 base-out states across 39 PAs, tracking baserunners and outs, so we get the maximized run potential an order can actually produce (akin to the sequencing optimizer that runs through base-out situations). The roster side ended up mattering, in this case, just as much as the model itself. You can enter in 10 or more hitters, and it picks the best 9 possible, flag hitters competing for the same spot and cap how many can play (Two first basemen are being debated, flag that those two are competing, and limit the filter to one of them playing). You can also lock anyone into a slot if you already know you want them there (I.E., leadoff guy, who you know is going to leadoff; feature coaches requested).
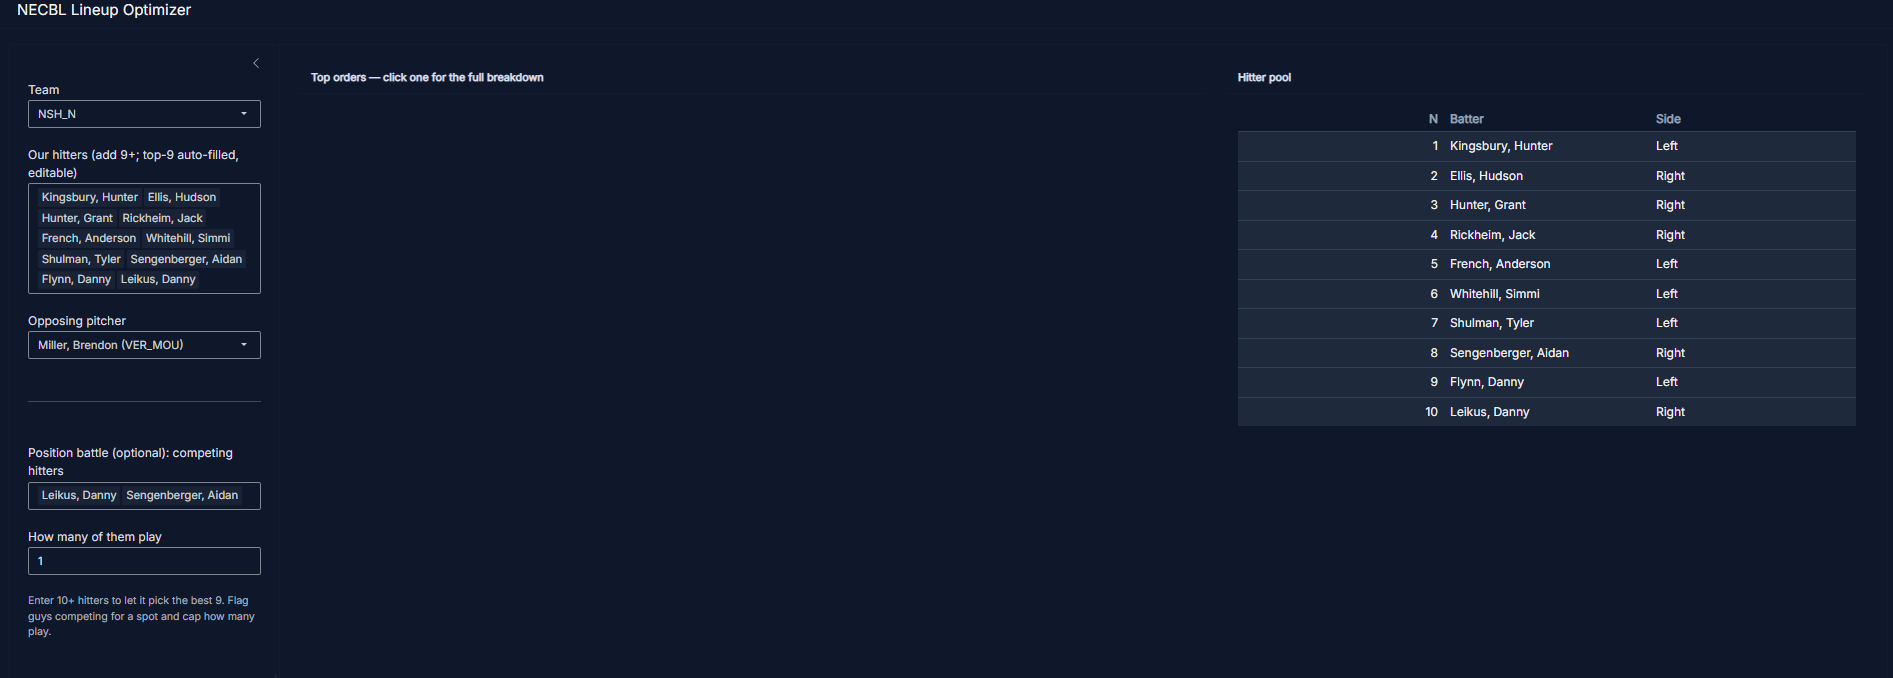
This is the initial setup when the user opens the optimizer. First, the user picks their team, and the top 9 by plate appearances auto-fill (and stay editable with a dropdown option to add or subtract as many batters as needed), the opposing starter gets picked from the pool of all pitchers in the league (chose Brendon Miller of Vermont here), and the constraints sit below that. Entering in 10 or more hitters, as I did here, turns on the best-of-9 selection. It enumerates all valid combinations, evaluates them against the specific starter, and keeps the strongest. Obviously, if you are entering 10 or more players, there is a position battle at play, whether it be you are debating between two catchers or four outfielders, and the position battle constraint tells the engine that one of those guys has to be kept out of the lineup. To demonstrate that, I flagged Danny Leikus and Aidan Sengenberger (both catchers) as competing for the same spot with a cap of 1, which drops every combination playing both Leikus and Sengenberger before the search even runs. This is a deliberate choice, as the constraints filter for the potential lineup combinations that can actually happen.
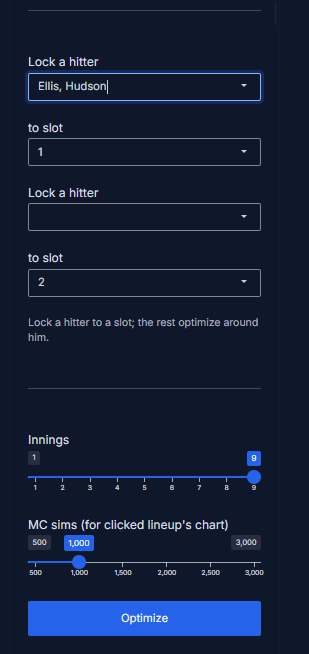
Slot locks are the third constraint added, in the case that a coach knows he wants a player in a specific spot. Here, Hudson Ellis is pinned to the leadoff slot, so the search is then restricted to just the eight slots behind him. This was an addition for the coaching staff, as I knew that regardless, Hudson Ellis would be in the leadoff spot (which I also felt to be a smart choice). The innings slider sets the length of the game being simulated (sometimes NECBL games are 7 innings), and the MC sims slider controls the number of simulations that are run.
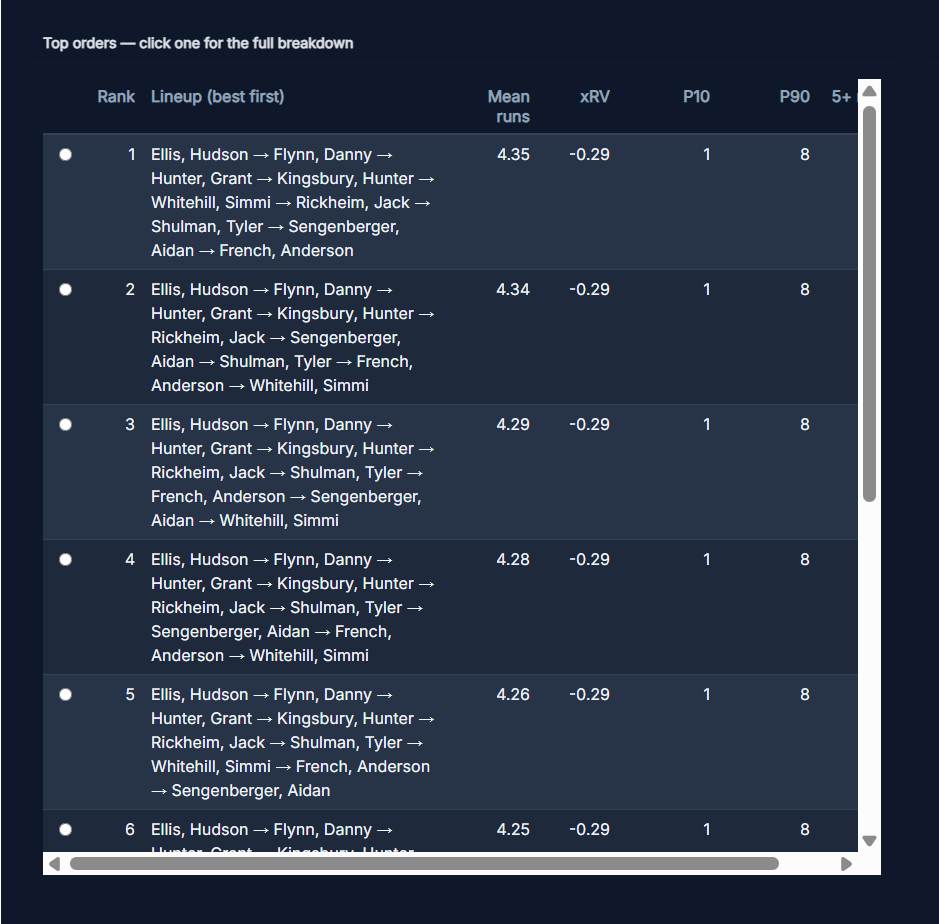
After clicking "optimize" at the bottom, every order is then scored. Each of the hitters in the lineup carries his own plate appearance line (batted ball and plate discipline probabilities) against Brendon Miller specifically, built from the pitches that Miller actually throws, where they are located, the counts he throws them, and to that hitter's side, which then get played through all base-out states to determine the run scoring. As seen in the table, this is why the ranking system is through mean runs rather than xRV. The summed xRV total for all orders is identical to two decimals at -0.29, while the mean run values separate them all from 4.35 to 4.18. As mentioned quite a bit previously, xRV is additive and context-neutral, so a reordering of the same nine hitters doesn't change anything, which is why the simmed games with proper base-out state context matter. While all lineups say similar things (with P10 at 1 and P90 at 8), the separation lives in the middle of the distribution rather than the high end and low ends. All of the lineups start with the same top half (Ellis, Flynn, Hunter, Kingsbury) and only differs in the back half, which is where the entire 0.17 run distribution comes from in these top 10. There is also a column for the percentage of times that the specific lineup scores 5 runs (see this in image below, got cut off in top one), but it didn't align with the mean run rankings, as the second order converts at 43%, while the top order at 42.2%, showing that, by a slight amount, that top lineup is slightly more consistent in the middle of the distribution.
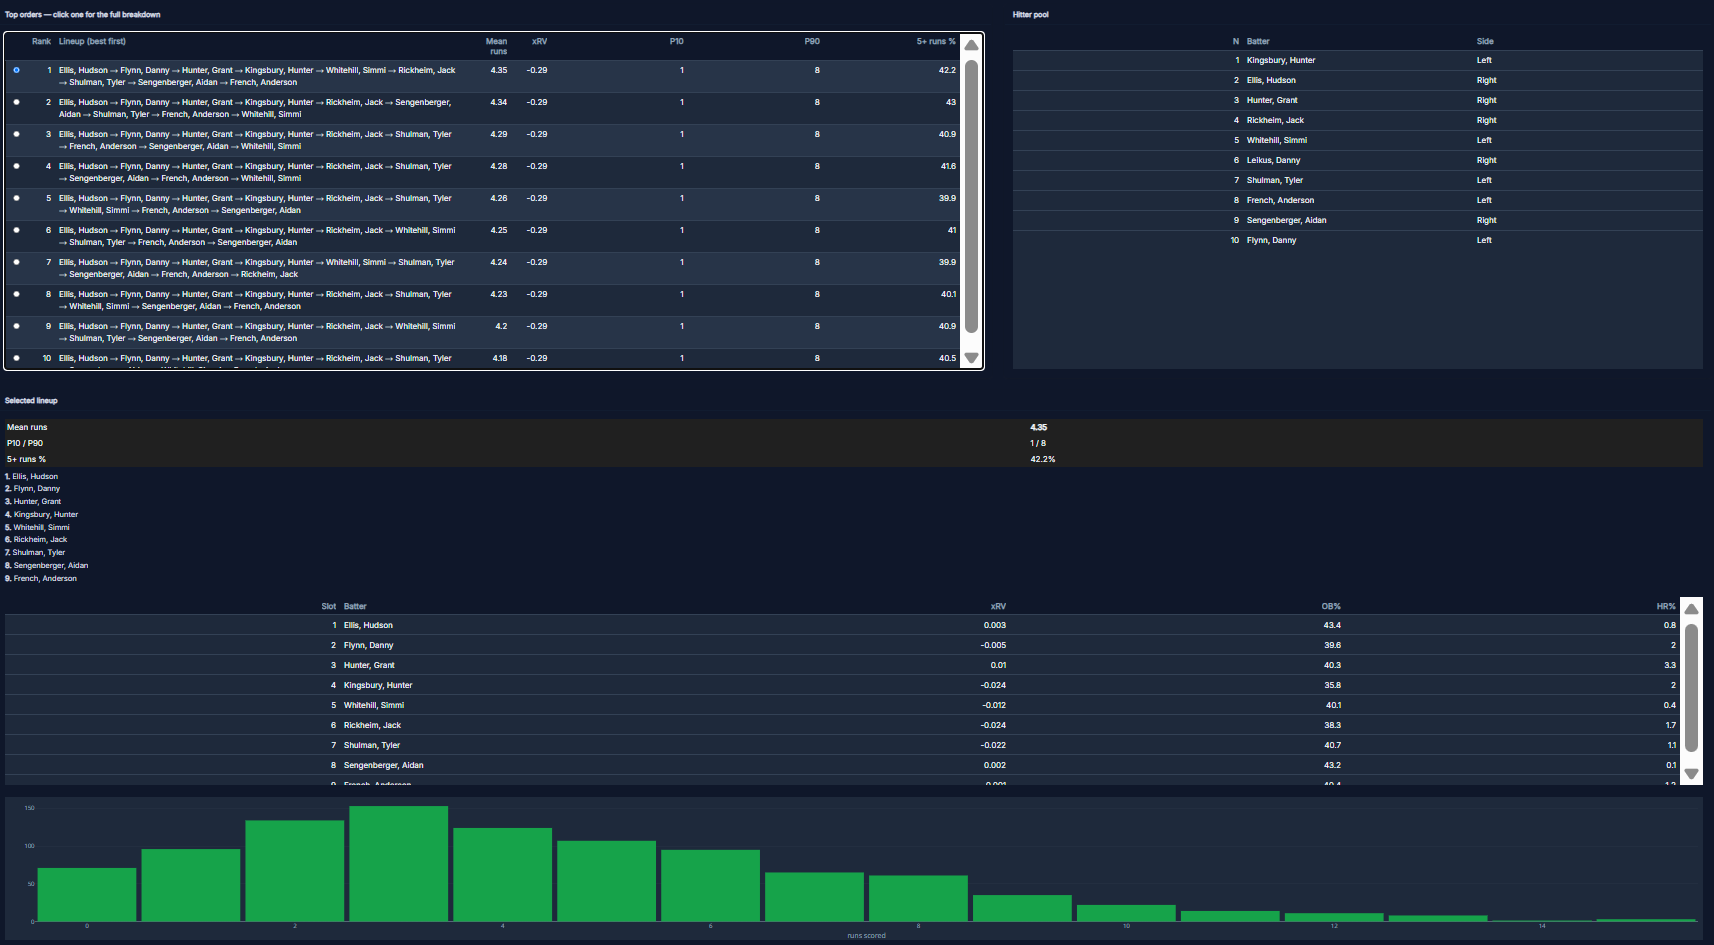
Clicking any order opens it up and gives a breakdown (both of the run scoring and the contributions of each batter). As you can see, I clicked on the top lineup. The top line of the dropdown shows mean runs (4.35), the 10th and 90th percentile outcomes (1 run and 8 runs), the chance of a 5-plus run game (42.2%), and underneath is the order itself, along with a line for each hitter with the xRV, on-base percentage,and home run rate against this particular pitcher. As you can see, the constraints become visible with Leikus and Sengenberger, as Sengenberger is in the 8-hole, while Leikus is not, as, the optimizer sees Sengenberger as a more favorable matchup against Miller. Hudson Ellis leads off, as he was pinned to that spot, and then, not shockingly, the engine has Grant Hunter and Hunter Kingsbury respectively in the 3 and 4 behind him, who have the highest projected home run rates against Miller. The base-out calculation puts Hunter in the three-hole and Kingsbury in the cleanup spot as it is the slot where runners are more likely to be on, and where they can respectively do the most damage. Then, the chart at the bottom is the runs-scored distribution for this order across the simulation.